Financial Highlights

Financial Highlights

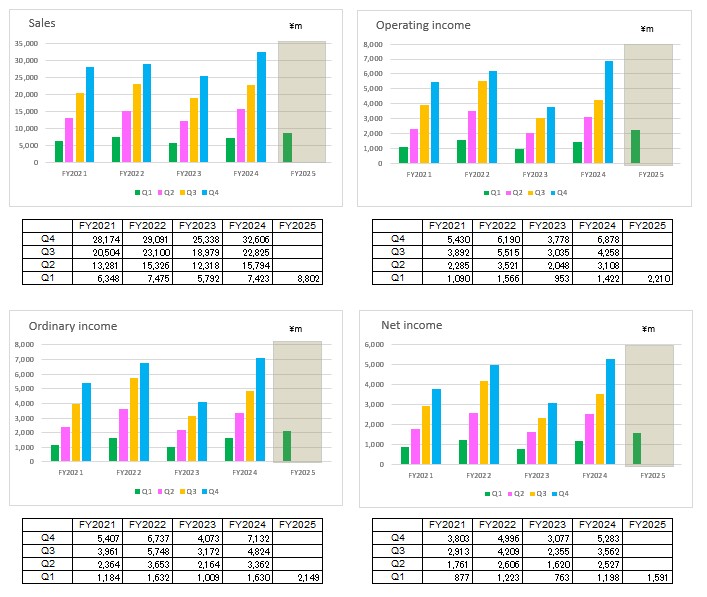
This section presents UT’s selected and summary financial information.

chart
  Sales Operating
income
Ordinary
income
Net
income
FY2023 Q4 - - - -
Q3 18,979 3,035 3,172 2,355
Q2 12,318 2,048 2,164 1,620
Q1 5,792 953 1,009 763
FY2022 Q4 29,091 6,190 6,737 4,996
Q3 23,100 5,515 5,748 4,209
Q2 15,326 3,521 3,653 2,606
Q1 7,475 1,566 1,632 1,223
FY2021 Q4 28,174 5,430 5,407 3,803
Q3 20,504 3,892 3,961 2,913
Q2 13,281 2,285 2,364 1,761
Q1 6,348 1,090 1,184 877
FY2020 Q4 22,817 2,864 2,836 2,539
Q3 16,552 1,978 1,988 1,682
Q2 11,027 1,348 1,402 1,078
Q1 5,274 613 599 467
FY2019 Q4 22,877 3,074 2,963 2,383
Q3 16,599 2,218 2,207 1,741
Q2 10,945 1,537 1,516 1,205
Q1 5,373 833 807 641

For Investors

CONTACT

Send product inquiries or download catalogs here.